

|
Statmaster The Simplest Way To Graph Your Data |
|
|
statmaster.zip — Statmaster for Windows 95..XP |
|
User manual and update history (also included in the distribution).
| |
|
This is the home of Statmaster — the simplest, no-nonsense solution to data graphing needs for scientists, engineers and students. If you are in this group, you may be running some programs, which are number-crunching applications used in your work, research, or school projects, but which do not have any graphic presentation of results, as that would be too expensive and/or time-consuming to add. Besides, you focus on your problem, not on graphics! You may try to use one of available commercial data presentation and reduction packages, some of them excellent tools on their own (or even a spreadsheet), but all of them are not too easy to use. They also cost money and you cannot distribute them with your specialized application. Here comes Statmaster. This is not a heavyweight champion of data presentation, but the few things it does, it does neatly, with no pain, and not much effort. You can hook up your FORTRAN (Basic, C, whatever), text-only application to Statmaster in less than half an hour, and enjoy seeing your results in their full graphic glory. |
| |
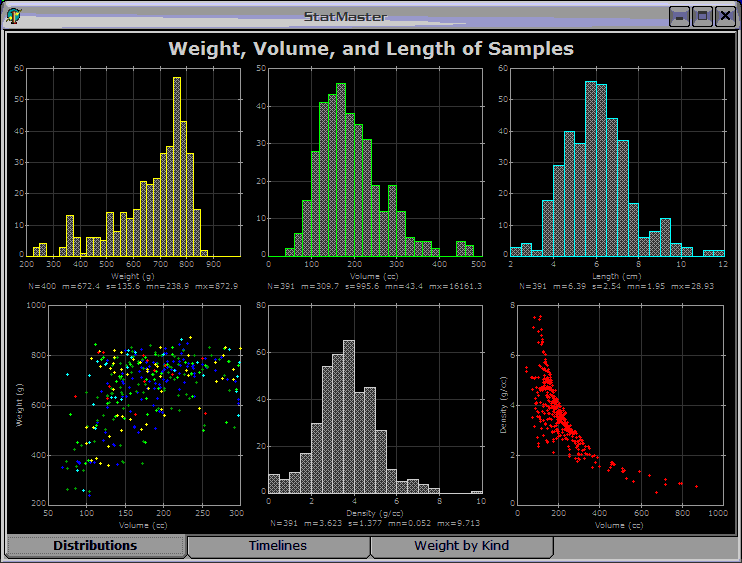
| Screenshot from the example data included with the program. |
|
Statmaster is run from the command line interface (often referred to as "DOS window") from Windows 95, 98, ME, NT4, 2000, or XP. You run it by issuing a command like statmaster mysetup.stm.ini mydata.dat where mysetup.stm.ini is the Statmaster setup file, telling the program how to present the data, and mydata.dat — the data file containing the data to show. The latter is a regular text (ASCII) file containing your data in lines, a certain number of items to a line. At this moment, Statmaster does histograms, scatter (XY) plots, and line graphs; it also computes basic statistical parameters of data populations. I may add some other features (including linear and polynomial regression) if there is enough interest. The graphs are shown in up to sixteen tabbed pages, and each page may hold up to 64 graphs, enough for most uses. Graph attributes (color, background, marker type, histogram fill, font) are defined in the setup file; so are graph ranges and histogram attributes, although you may leave these to be computed by the program. Being run from the command line, Statmaster can be used from batch files, automating the process and possibly linking a number of your computational applications together with graphic presentation of results. The program has been used for the last few years on a number of campuses and within my company, where it serves as a data presentation back end for a $400k simulation system. Only a few years ago I decided to add to it the necessary documentation and to make it available to general public. The distribution archive contains a brief (but, hopefully, sufficient) user manual, plus three example setup files, heavily annotated, together with the data they all use. You may use these files as a starting point for your own experiments.
Statmaster is free for personal and educational use. Government and corporate users should |
| Home: wrotniak.net | Search this site | Change font size |
| Posted 2004/03/16; last updated 2007/04/18 | Copyright © 2004-2006 by J. Andrzej Wrotniak |
